Scenario: it’s 4 p.m., before dinner service. You want to know how many parties are coming tonight, whether any bookings still need confirming, and whether the weekend is busy enough to staff up. Overview, the first page of the back office, exists for exactly that glance.
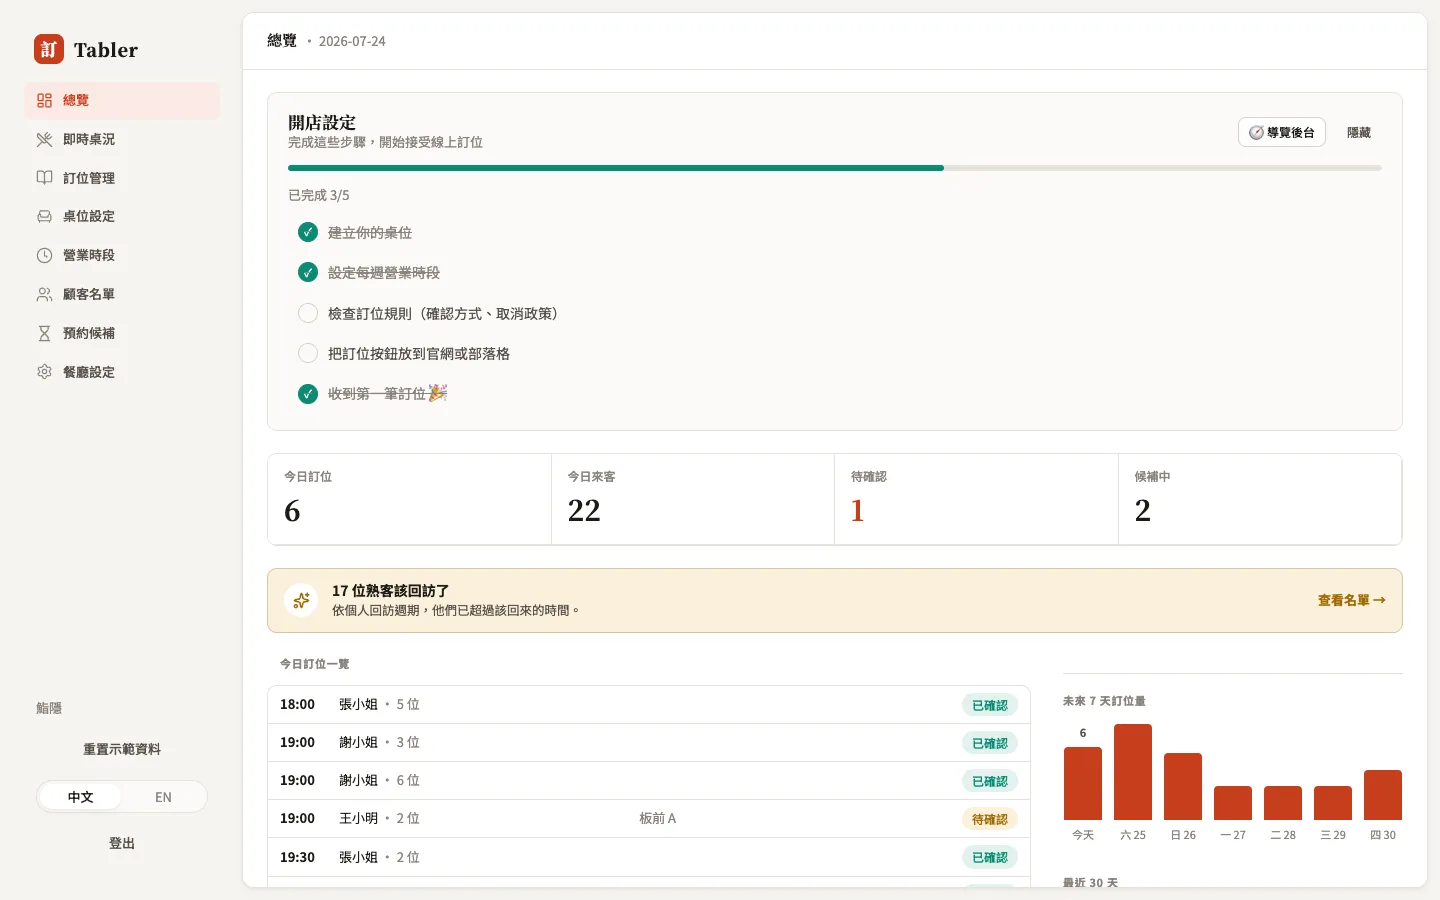
Today’s four numbers
- Today’s bookings / Today’s covers — parties and total guests today.
- Pending — bookings a review-first restaurant confirms one by one; when the count is above 0 it becomes a highlighted alert, and clicking it jumps straight to the pending list in Reservations.
- Waiting — parties on the future waitlist still waiting for a table; click through to handle them.
Below, Today’s reservations lists what’s coming up (time, name, party size, table, status); View all opens the full list.
Bookings, next 7 days
The bar chart on the right shows bookings and covers for each of the next seven days, with peak days highlighted — check it before scheduling staff or prep. Underneath are three 30-day numbers: total bookings over the next 7 days, the 30-day no-show rate, and new guests in 30 days.
Insights (last 90 days)
Insights, further down the page, distills your actual records from the last 90 days:
- No-show rate — helps you decide whether to switch to review-first confirmation or shorten the self-cancel window.
- Covers by weekday — guest volume across the week; spot your Friday and Saturday peaks.
- Busiest hour / Avg turn time — the basis for table planning and the dining time setting.
- Queue volume — how much the walk-in queue gets used.
Demand forecast predicts each day’s covers for the coming week from your history. It’s part of the Pro plan’s AI insights; on the free plan you’ll see a preview with an upgrade note — your raw data is always free.
Regulars nudge
When regulars go past their own usual return rhythm, Overview shows a nudge (for example, “17 regulars are overdue to return”). Click See list to open the Regulars tab of Guests and work through them one by one.